Troubleshoot SOLIDWORKS add-in developed with SwEx framework
SwEx framework outputs the trace messages which simpifies the troubleshooting process. The messages are output to the default trace listener.
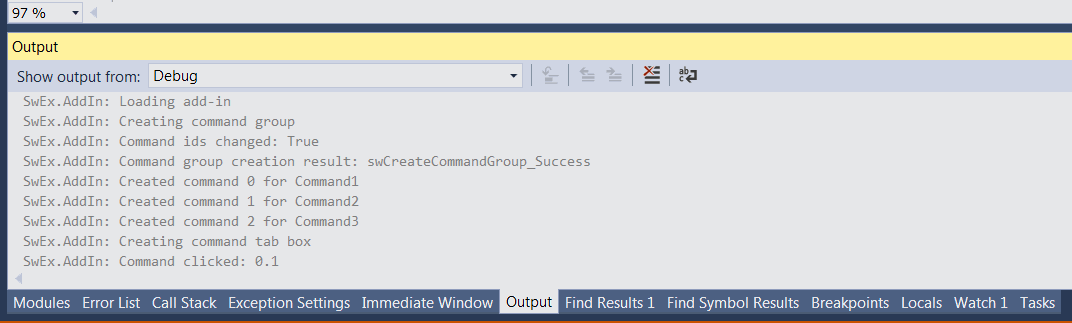
If add-in is debugged from Visual studio than the messages are output to Visual studio Output tab as shown below:
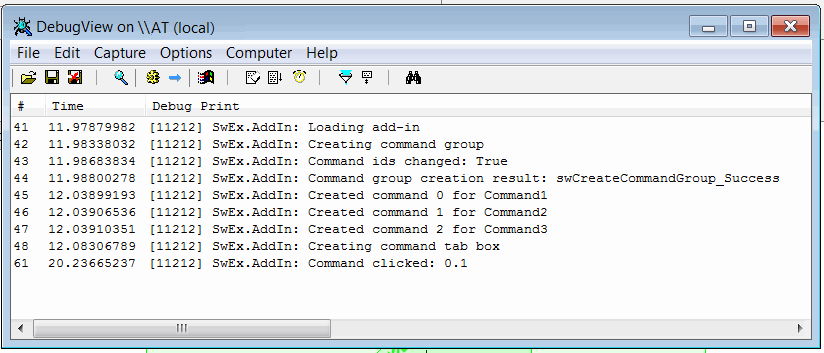
Otherwise messages can be traced via DebugView utility by Microsoft
- Download the utility from the link above
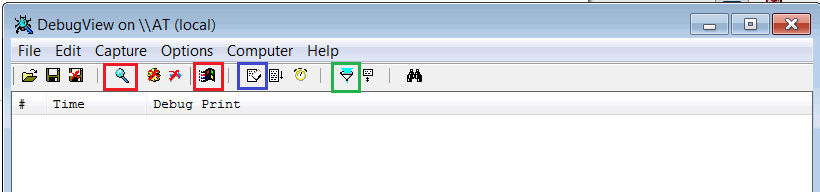
- Unzip the package and run Dbgview.exe
- Set the settings as marked below:
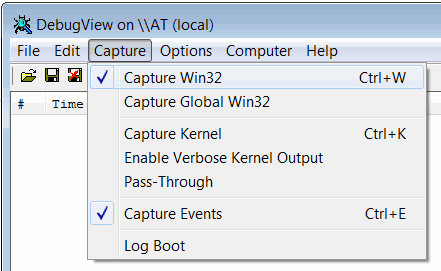
Enable Capture Win32 and Capture Events options from the toolbar (marked in red)
Alternatively set the capture options via menu as shown below:
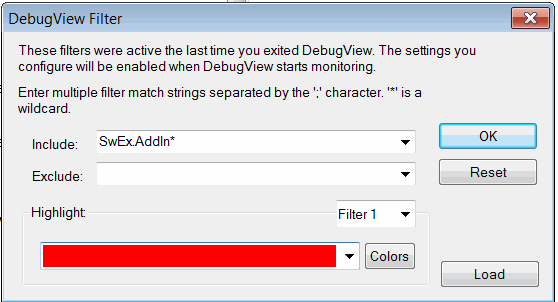
Set the filter to filter SwEx messages by clicking the filter button (marked in green)
Messages will be output to trace window
Use eraser button to clean messages (marked in blue)
Notes
- Trace output is very powerful tool for troubleshooting the add-in on clients computers
- DebugView tool is lightweight and doesn't require installation and is provided by Microsoft
- Trace messages will be also output in the release mode
- SwEx framework will output the exception details if thrown while loading of the add-in which can help solving the problem when add-in cannot be loaded
Custom messages and exceptions can be logged from SwEx module. Follow this link for more information.